Zero to MVP: Launching an Energy Engineering SaaS Tool in 90 Days
-
Product Type
SaaS -
Domain
Energy Distribution -
Timeline
90 days -
Team
1 PM, 3 Engineers, 1 Data Scientist, 1 UX Researcher
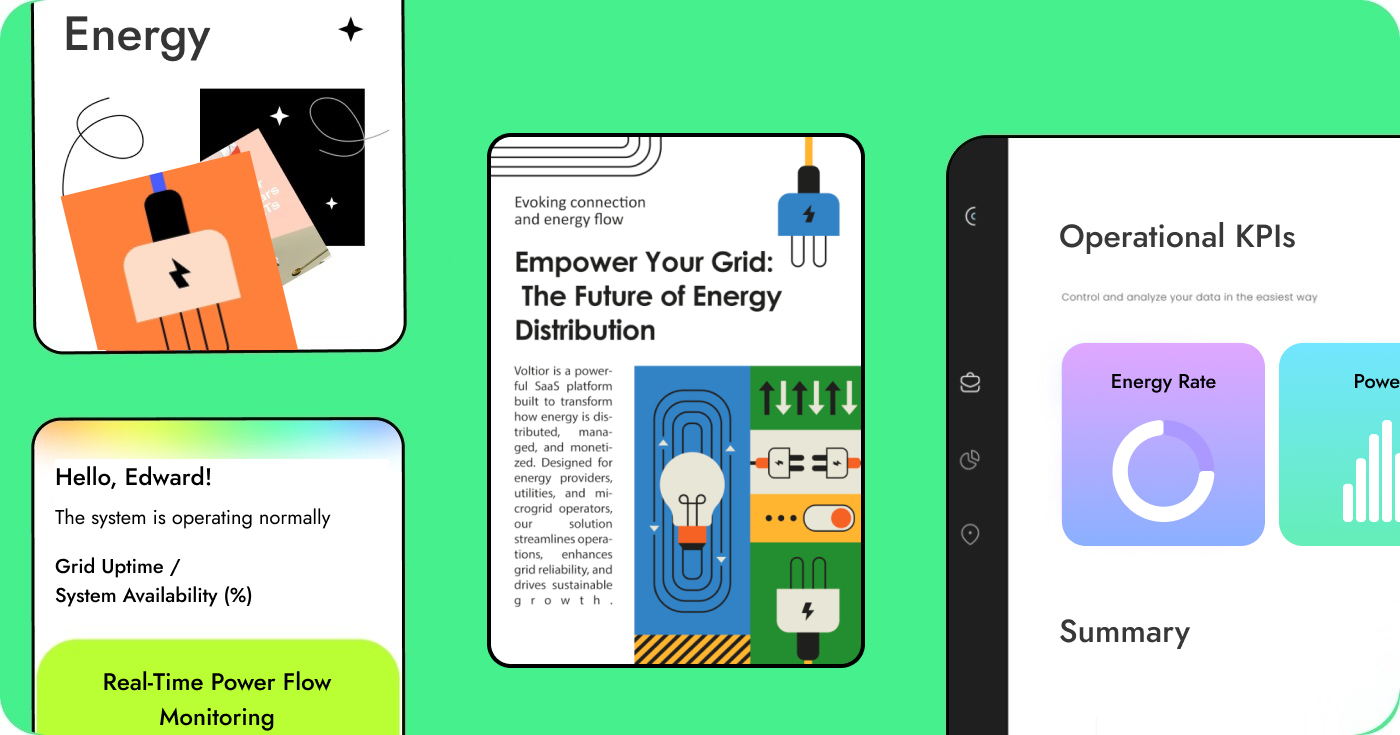
Project Overview.
I led the design of a SaaS platform built for energy infrastructure teams to monitor grid health, detect anomalies, and optimize energy load distribution across regional networks. The product integrates real-time sensor data with historical trends to support faster, data-driven decisions in utility operations.
The challenge: ship a fully functional MVP for utility operators and engineers—within 90 days.
Phase 1: Discovery and Definition (Week 1–2)
- Worked closely with stakeholders from energy providers to understand field workflows, control center pain points, and compliance requirements.
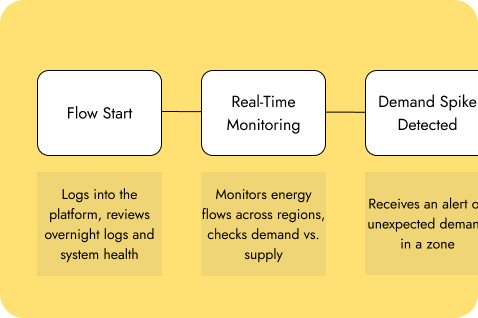
- Mapped the end-to-end journey of a grid engineer during a load-balancing event, identifying key friction points (slow alerts, manual reporting, siloed tools).
- Collaborated with the PM to define MVP scope focused on real-time grid health visualization, load monitoring across substations, and predictive maintenance alerts.
Key Activities
Stakeholder interviews
Competitor analysis
Problem framing
Defining the MVP scope
Mapping core user journeys and workflows
Outputs
MVP Feature List
Product Brief and Problem Defition
Research Data and Insights
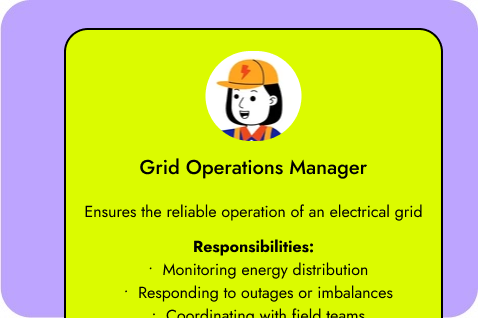
Key Personas and User Journeys
MVP Success Criterias
Epics and user stories

Phase 2: UX design (Week 3-7)
- Generated design ideas and hypothesis
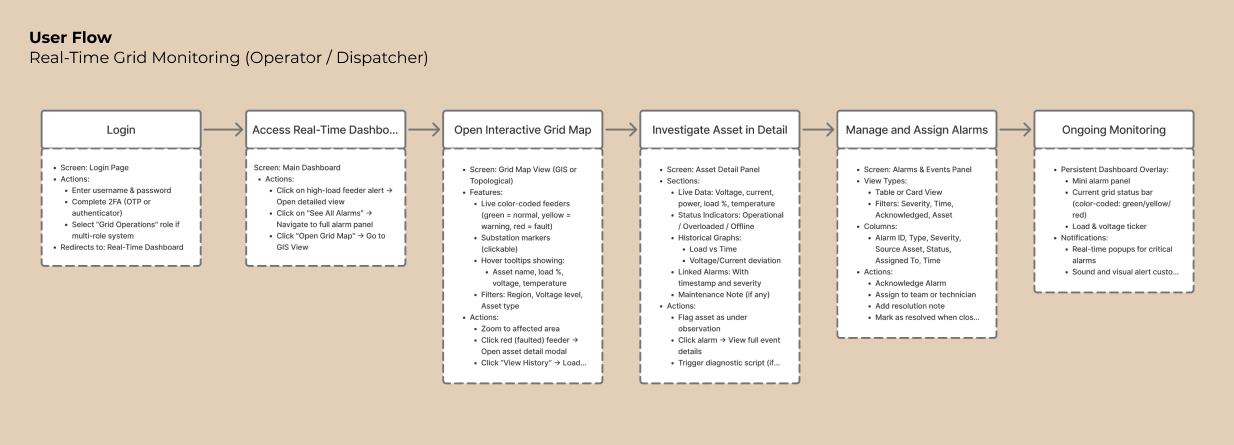
- Sketched user flows (such as energy usage monitoring, alerts, billing)
-
Built low-fidelity wireframes for key screens:
- Login and Onboarding
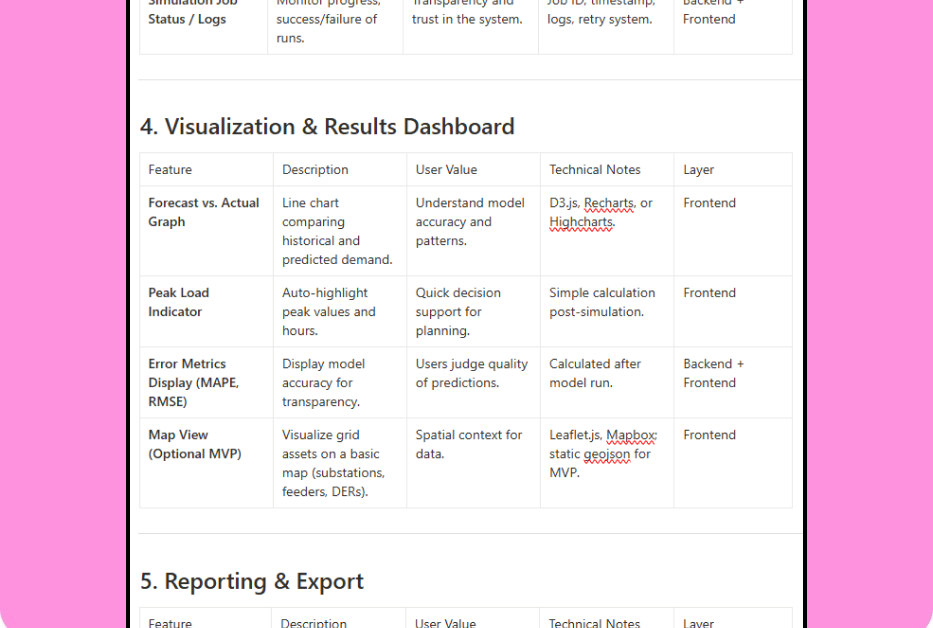
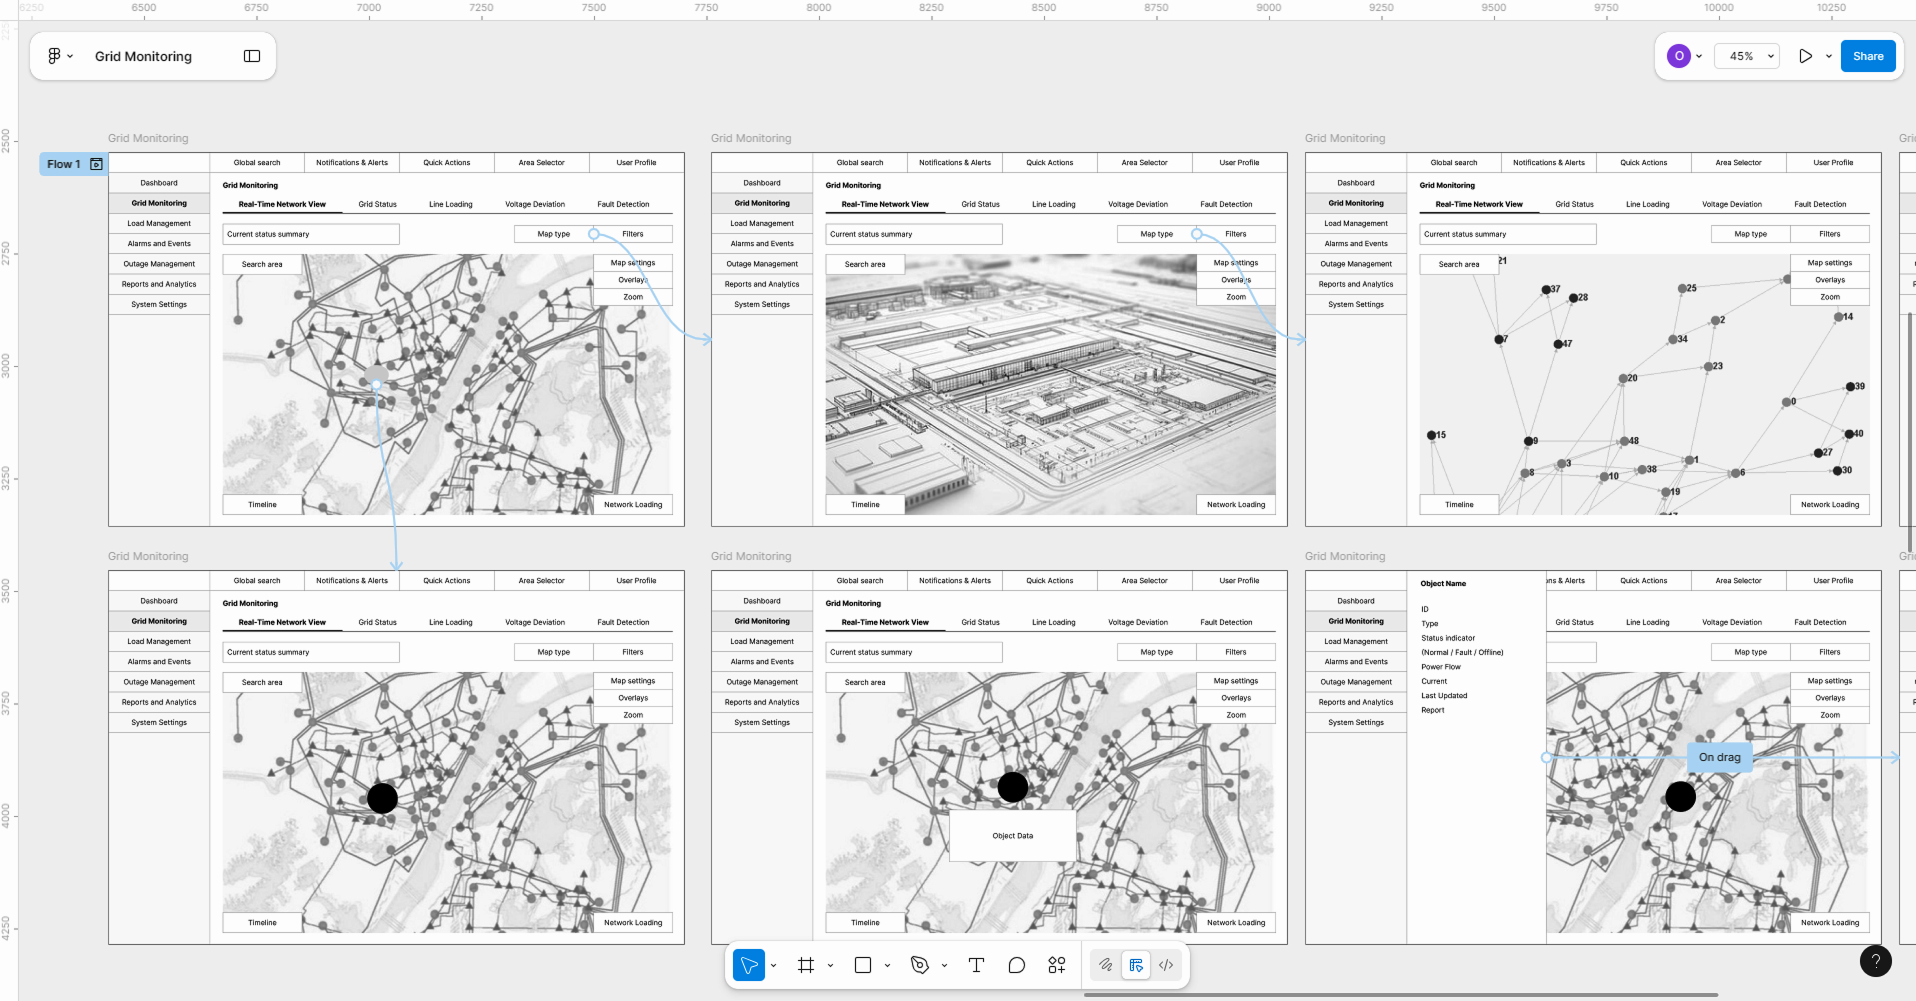
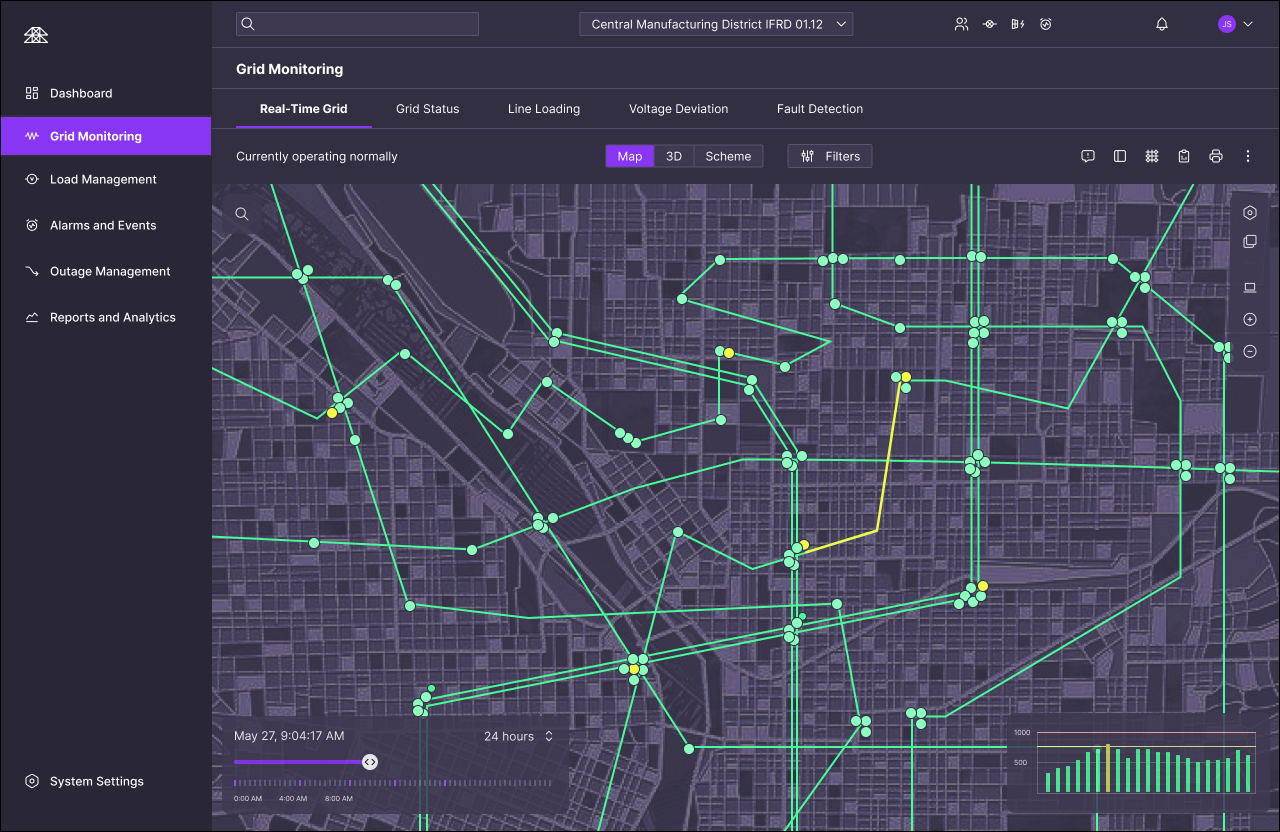
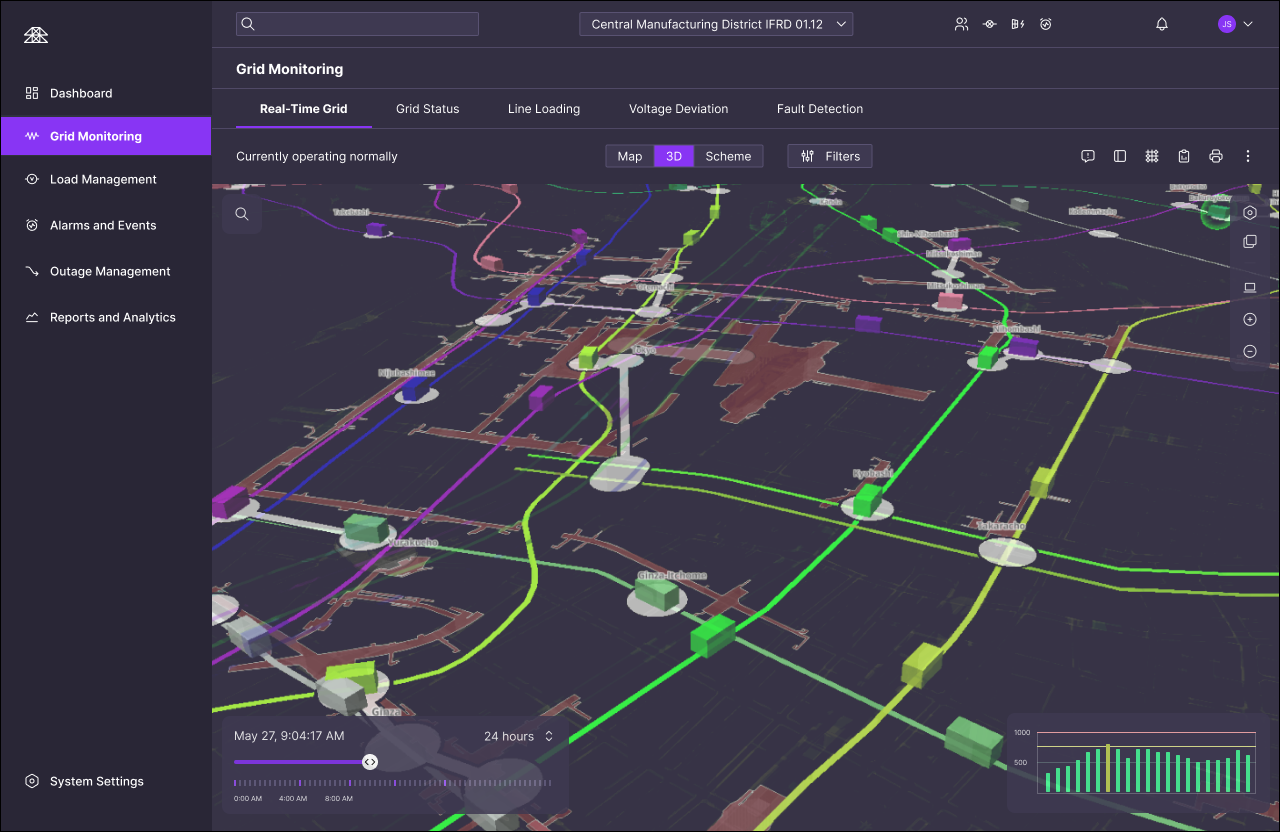
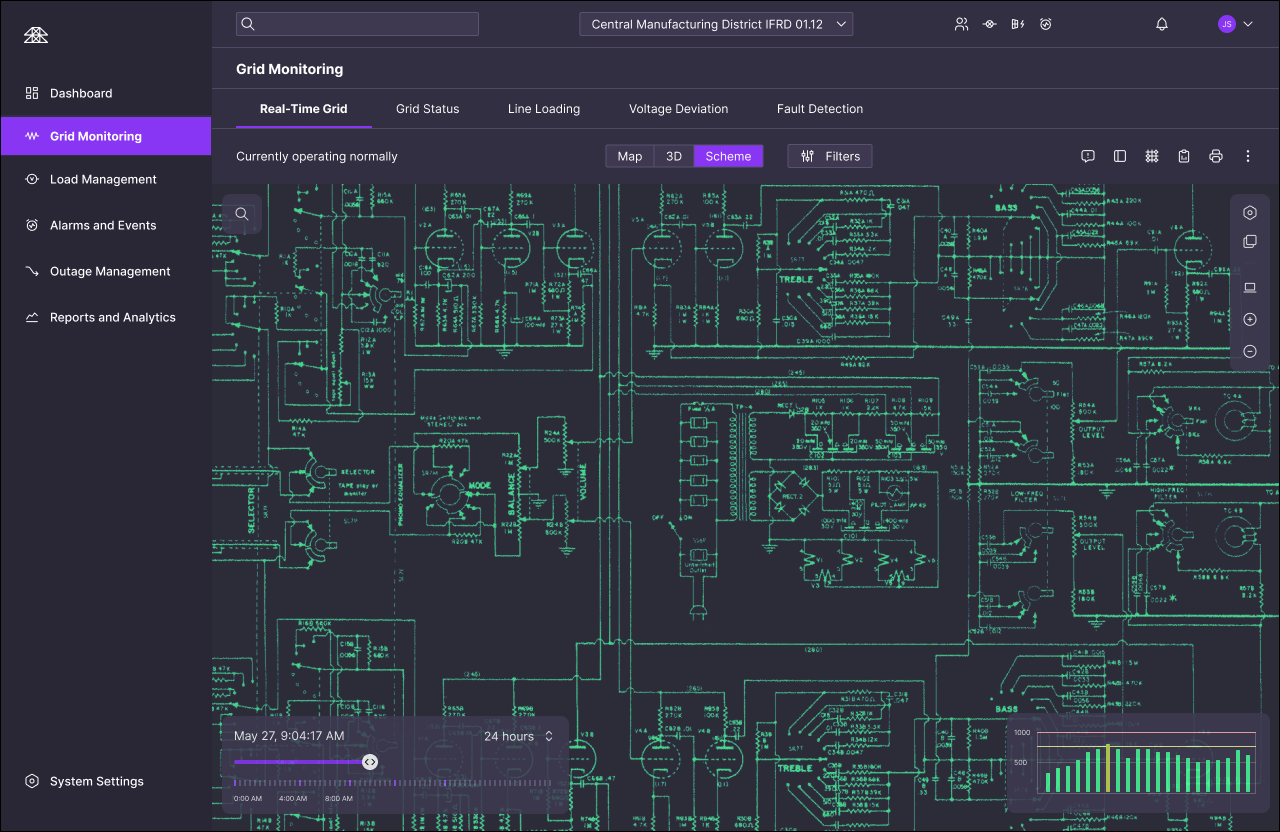
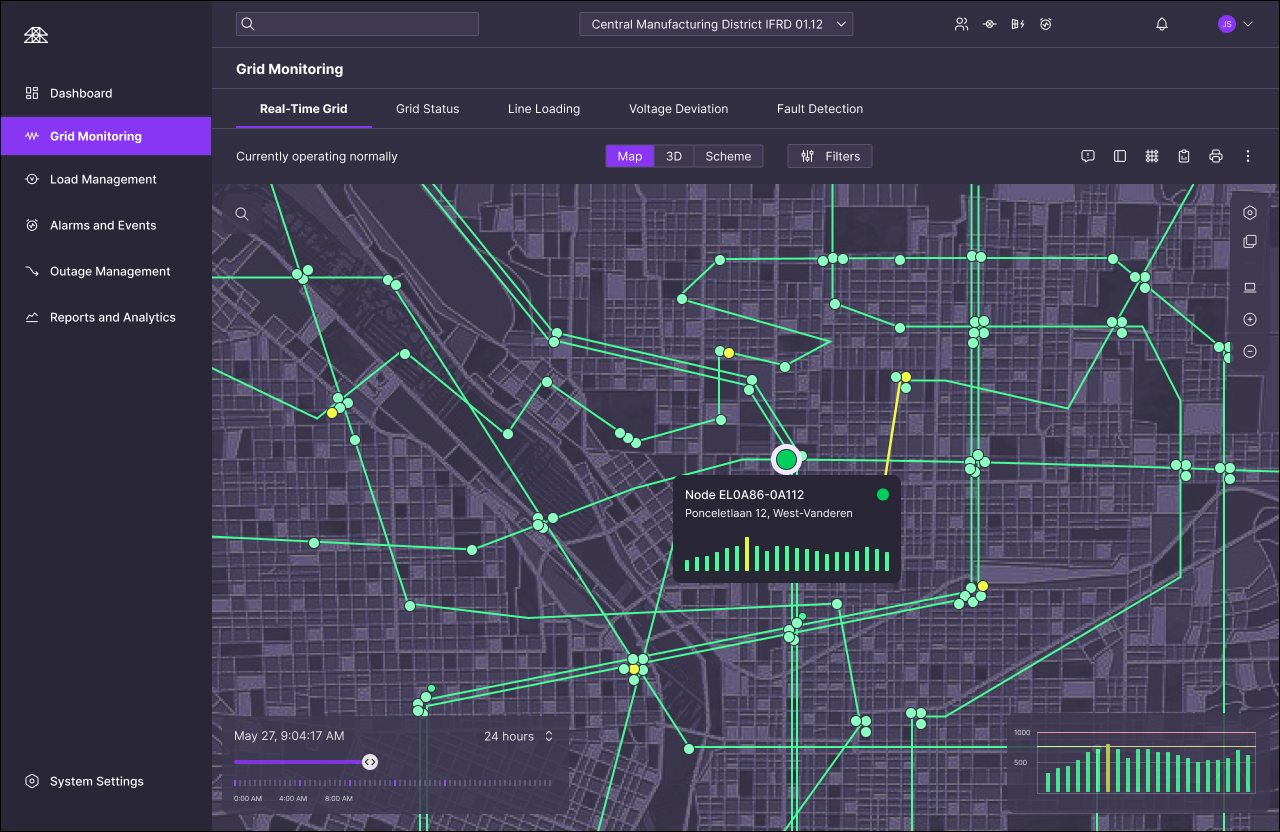
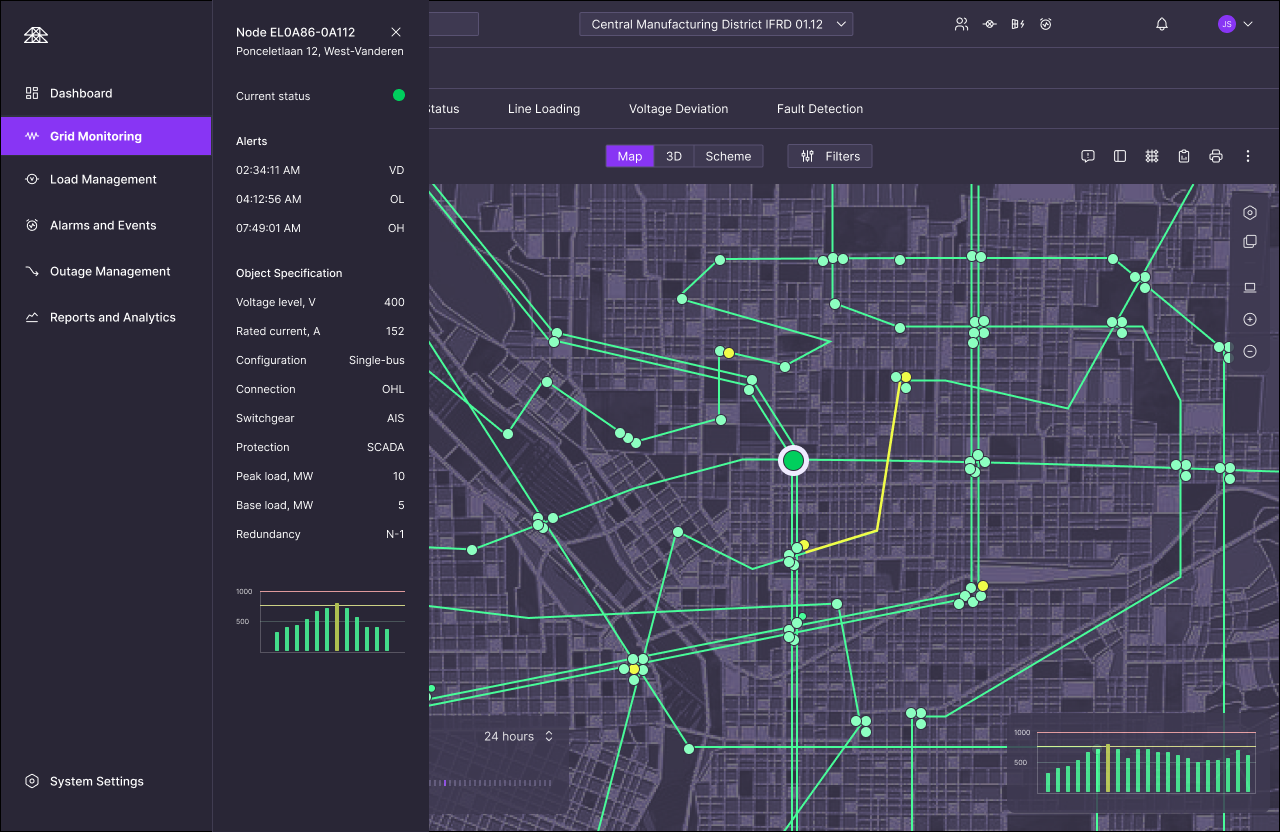
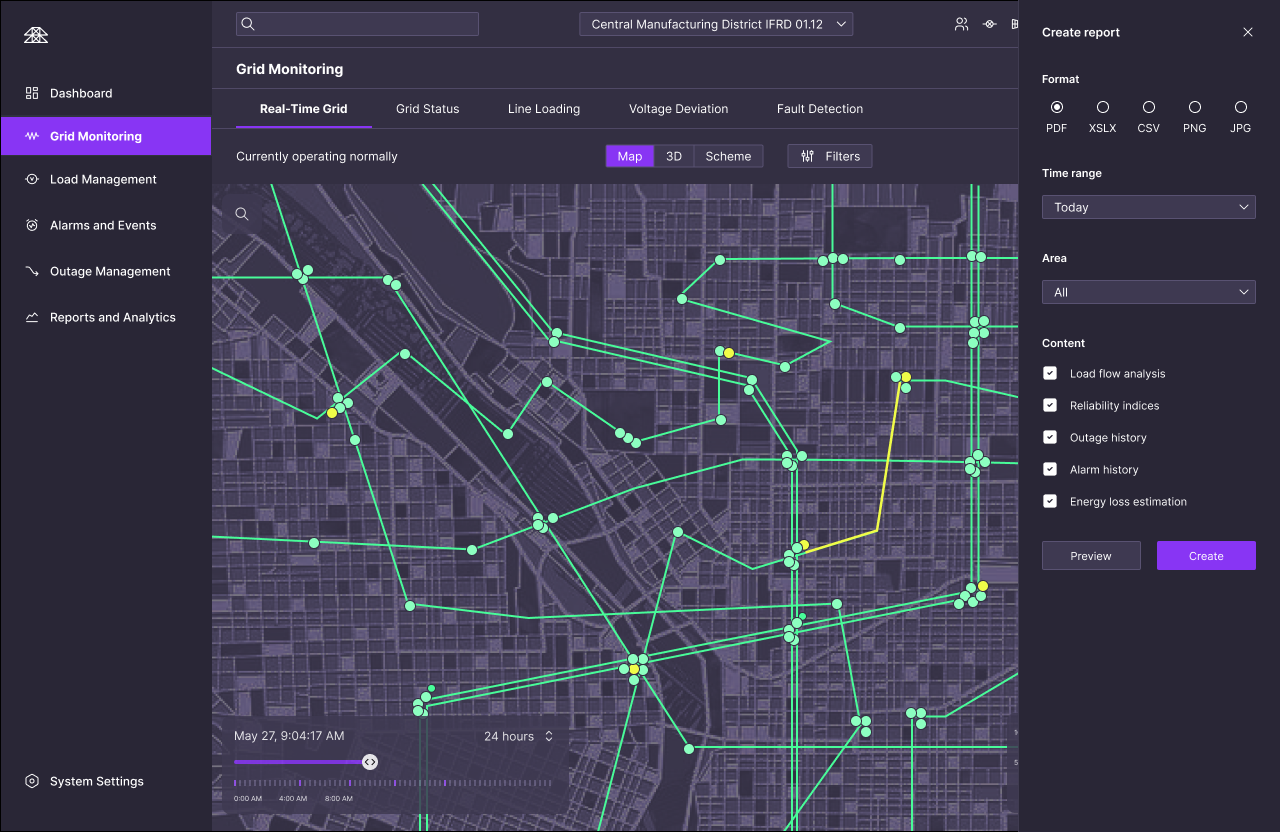
- A real-time Grid Dashboard with geospatial overlays showing substation load, fault alerts, and capacity thresholds
- Grid Monitoring and Management
- Asset Management
- Energy Consumption Analytics
- Billing & Payments
- AI and Optimization Engine
-
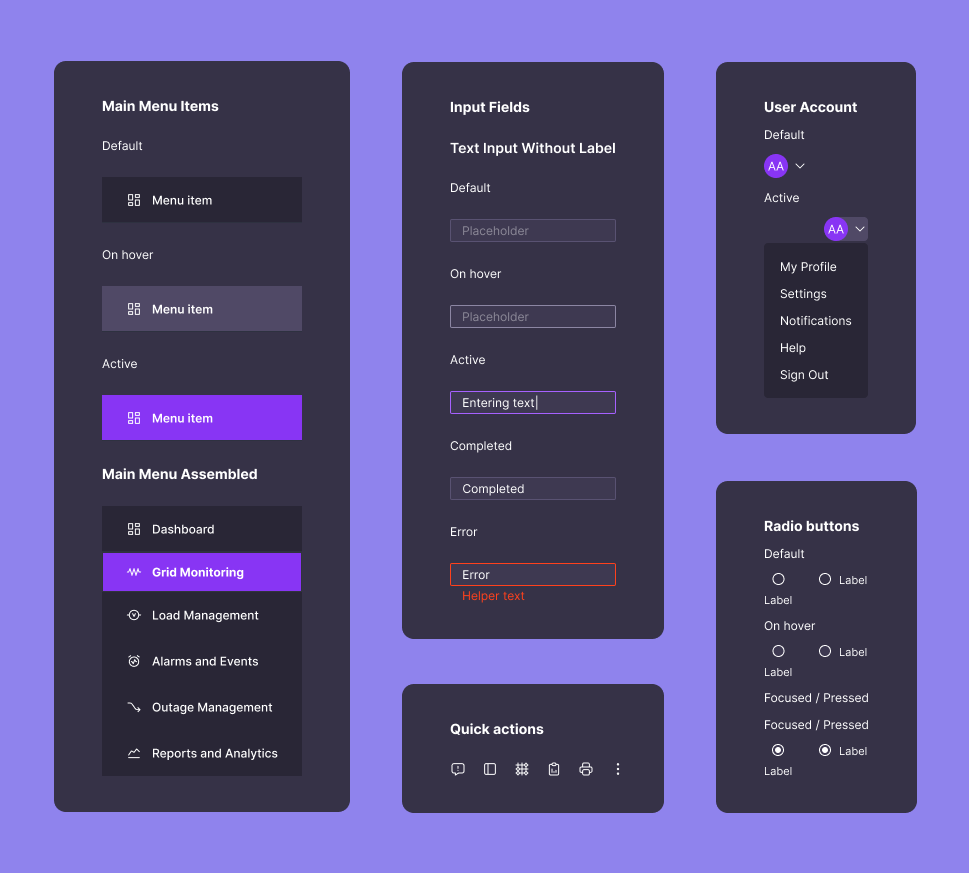
Laid the foundations of Design System:
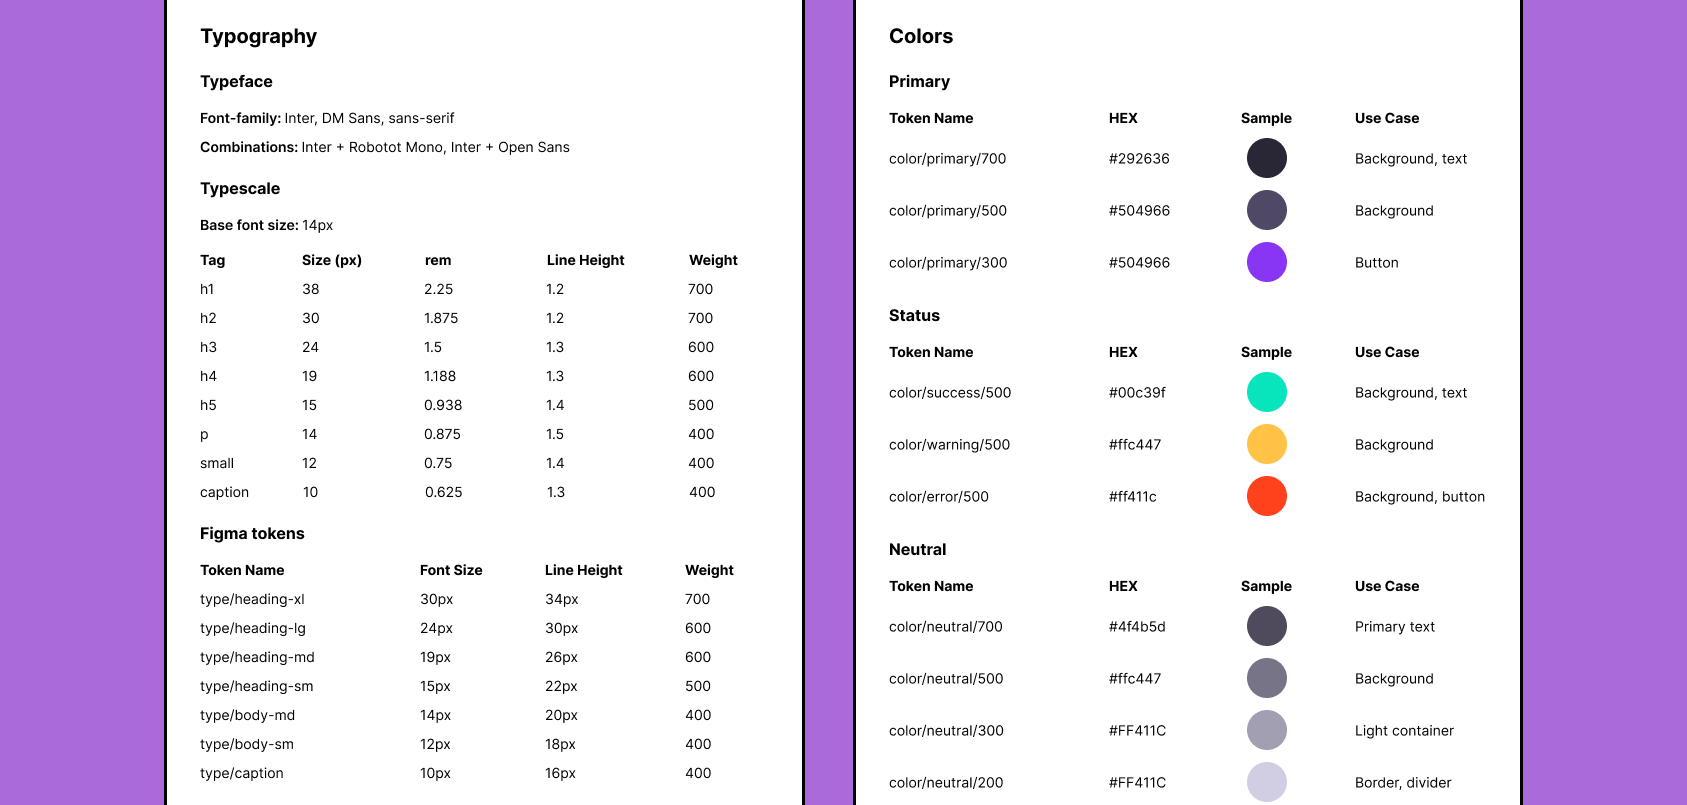
- Chose visual style (color palette, typography, iconography)
- Created core UI components
- Designed high-fidelity mockups of key screens
- Created clickable prototypes
- Designed mobile and tablet-responsive layouts
Key Activities
Ideation
Sketching
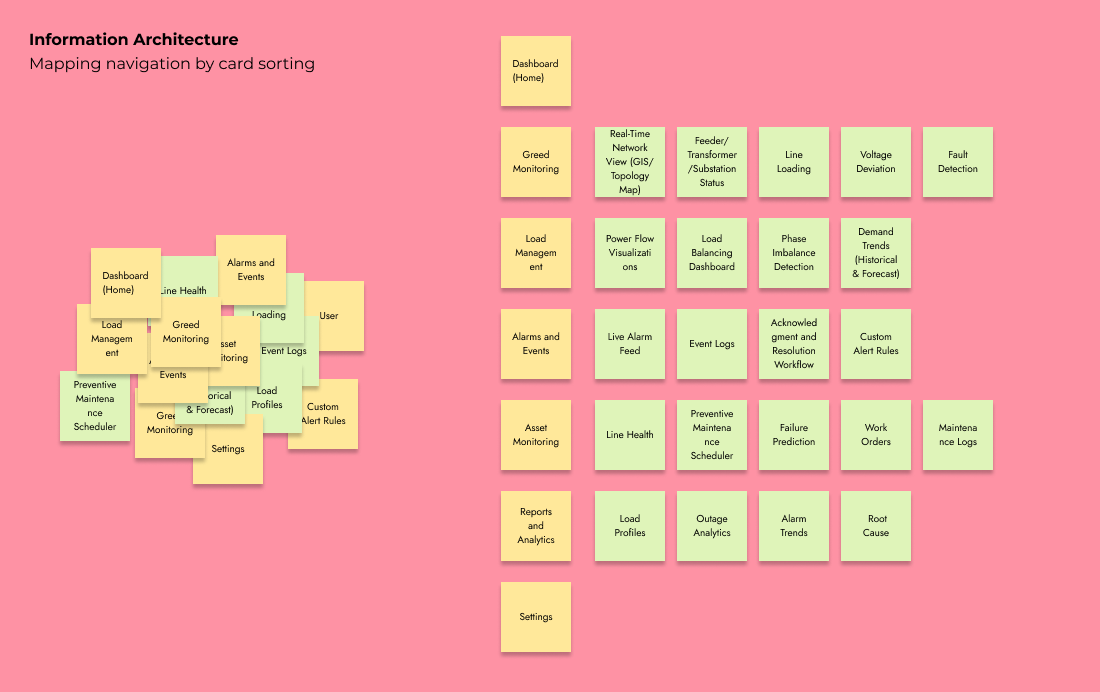
Information Architecture Design
Wireframing and Prototyping
System Design
Outputs
Sketches and Concepts
Information Architecture Diagram
Wireframes
Mockups
Clickable Prototypes
Design System (in Figma)
Phase 3: Validation and Refinement (Week 8–9)
- Conducted testing sessions using high-fidelity prototypes layered with dummy sensor data.
- Feedback led to key UX improvements:
- Added alert prioritization tags
- Improved contrast and readability
- Streamlined filters and region toggles for faster situational awareness
- Collaborated with engineers to implement performance optimizations for rendering real-time data on map components.
Phase 4: Engineering Collaboration & Launch (Week 10–12)
- Paired with front-end and data engineers to finalize UI states for live data streams, offline fallback modes, and edge cases.
- Delivered a developer-friendly spec with component documentation, user flows, and error-state coverage.
- Led a first-time user onboarding walkthrough for stakeholders and potential users.
Results
- MVP launched successfully to 3 pilot utility partners operating in different areas.
- Platform enabled:
- 25% faster detection and resolution of minor grid faults
- Improved operator confidence through clearer alerting and mapping
- o Early predictive alerts validated by field engineers during real-world deployment
- The design foundation became the basis for new modules including compliance reporting and incident replay.


